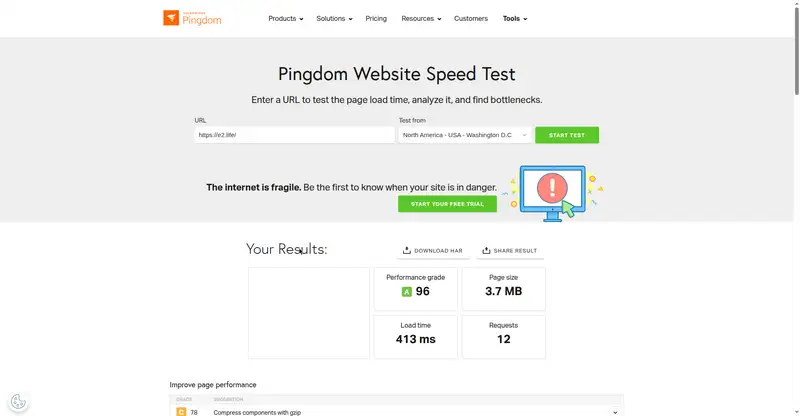
e2.life
October 9, 2026
413ms
Load time
A 96
Grade
3.7MB
Page size
12
Requests
Fast load but heavy page. The 2.8MB film video preloads on the homepage. Trimming candidate.
These dated speed reports lived at /speed/ ("Speed Reports: E2") before the Dev Blog existed. They are collected here intact, newest first, so every audit lives in one place. The originals remain at /speed/. Pingdom tests from Washington D.C., posted after each run.
Every figure in the reports below was measured on October 9 or October 11, 2026, on the setup of that day. Several are labeled pre-Cloudflare or pre-cutover baselines, so they describe where the sites started, not where they are now, and they cannot be re-verified after the fact. For current measured numbers, see the October 13 audits in this blog.
PageSpeed Insights: Performance 100, Accessibility 91, Best Practices 92, SEO 100. W3C: 1 error (aria-label on div). Pre-Cloudflare baseline.
Heavy page: 4.3MB across just 9 requests means a few very large assets (fonts). Pre-Cloudflare baseline.
Fastest of the three. API now on Cloudflare Workers. Pre-cutover baseline.
Fast load but heavy page. The 2.8MB film video preloads on the homepage. Trimming candidate.
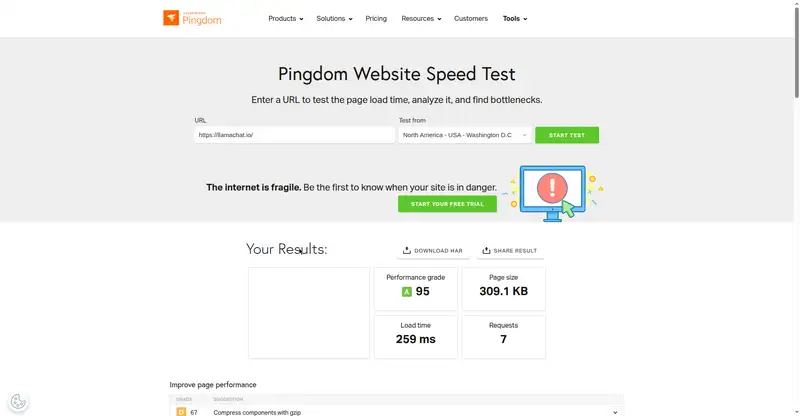
Flying. Under 300ms, under 350KB. This is the target.
Back to the Dev Blog index. Source page: e2.life/speed/.